
August Market Outlook: Growth Remains Intact, But Rising Yields and Sticky Inflation Are Creating New Challenges

In this August Market Outlook, we move into another important month for financial markets, investors continue to navigate a mixed environment.
On one hand, economic growth remains resilient, employment conditions remain healthy, and financial markets continue to benefit from supportive liquidity conditions. On the other hand, inflation remains stubbornly above the Federal Reserve's target, Treasury yields are approaching critical levels, oil prices continue rising, and the upcoming FOMC meeting could significantly influence market expectations.
The result is a market environment that remains constructive, but one where selectivity, risk management, and portfolio quality are becoming increasingly important.
Why the Economy Still Looks Healthy
Several key indicators continue to suggest the U.S. economy remains on stable footing.
Labor Market Remains Strong
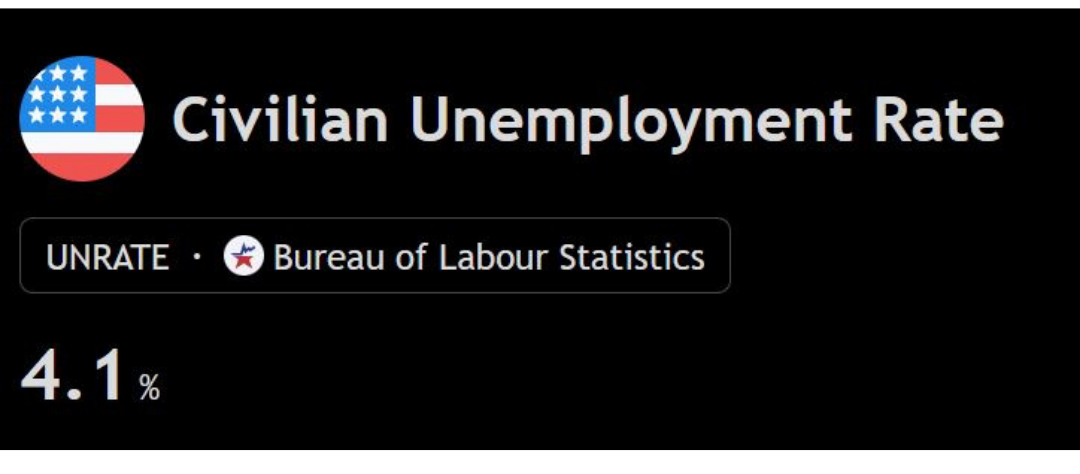
Weekly Jobless Claims remain low at 206,000, while the Unemployment Rate stands at 4.1%.
Historically, recessionary environments are often accompanied by rapidly rising unemployment and deteriorating labor market conditions. Current data continues to suggest businesses are still hiring and consumers remain employed.
Strong employment supports consumer spending, which remains the largest contributor to economic growth.
Manufacturing and Business Activity Continue Expanding
The latest ISM reading of 54.6 remains comfortably above the critical 50 level.
Any reading above 50 indicates economic expansion, while readings below 50 suggest contraction.
Although growth has moderated from previous highs, current levels continue to indicate that businesses are expanding production and economic activity remains positive.
Credit Markets Show Little Stress

Credit Spreads remain tight at approximately 2.7%.
Credit spreads are often one of the earliest warning signs of financial stress. When investors become concerned about economic conditions, credit spreads typically widen significantly.
Current levels suggest bond investors are not yet pricing in a major recession or widespread corporate financial stress.
Liquidity Remains Supportive
Liquidity remains one of the most important drivers of asset prices.
Current Net Liquidity stands at approximately $5.86 trillion. While the three-month trend has declined slightly by 0.68%, the contraction remains modest.
This indicates liquidity conditions are no longer improving aggressively, but they have not deteriorated enough to become a major headwind for risk assets.
For now, liquidity remains supportive of equities and financial markets.
Why Investors Should Pay Attention to Treasury Yields
One of the most important developments in recent weeks has been the rise in Treasury yields.
The 10-Year Treasury Yield has climbed to approximately 4.96%, placing it very close to the psychologically important 5% level.
Why does this matter?
Higher Treasury yields increase borrowing costs throughout the economy. Mortgage rates, corporate financing costs, and consumer lending rates often rise alongside Treasury yields.
Higher yields also affect stock valuations.
When investors can earn close to 5% from relatively low-risk government bonds, the attractiveness of paying premium valuations for equities becomes less compelling.
Historically, sustained moves above key yield levels can place pressure on growth stocks and other assets that rely heavily on future earnings expectations.
Technical Perspective: Treasury Yields Are Approaching A Critical Breakout
Beyond the fundamentals, technical analysis suggests Treasury yields may be entering a new bullish phase.
The US 10-Year Treasury Yield (US10Y) has recently broken above a long-term descending trendline and appears to be forming a potential Elliott Wave impulse structure.
The current setup suggests:
Long-term downtrend resistance has been broken.
Yield momentum continues to strengthen.
The 5% level is becoming increasingly likely to be tested.
If this technical pattern continues to develop, Treasury yields could potentially move into the 5.2%–5.8% range over the coming months.
For equity investors, this would be significant because rising yields typically:
Increase borrowing costs.
Raise discount rates used for stock valuations.
Pressure highly valued growth stocks.
Make bonds increasingly attractive relative to equities.
The higher Treasury yields move, the greater the pressure placed on stock market valuations.
NASDAQ 100 Remains Constructive Despite Rising Yield Risks

While Treasury yields are strengthening, the NASDAQ 100 continues to show a constructive technical structure.
The index remains within a rising trend channel and appears to be developing a potential Elliott Wave continuation pattern.
Current observations include:
The primary uptrend remains intact.
Price remains above major trend support.
A potential Wave (4) consolidation may be nearing completion.
A potential Wave (5) will be happening.
This suggests technology stocks may still have room to move higher if earnings growth remains strong.
However, this bullish scenario becomes more challenging if Treasury yields continue their advance beyond 5%.
The Key Battle: Earnings Growth vs Rising Yields
The market's next major move may ultimately depend on whether corporate earnings can continue to offset the pressure from higher interest rates.
Bullish Factors
Net Liquidity remains stable at $5.86T
Credit Spreads remain tight at 2.7%
Yield Curve remains uninverted
Jobless Claims remain healthy at 206K
Unemployment remains low at 4.1%
ISM remains expansionary at 54.6
U.S. Dollar remains in a longer-term downtrend
Household debt servicing remains manageable at 11.64%
Bearish Factors
Treasury yields approaching 5%
Core PCE remains elevated at 3.3%
Core PPI has increased to 4.6%
Federal Funds Rate remains restrictive at 3.63%
Crude Oil has risen to approximately $107
Government Debt stands at 123.3% of GDP
Fiscal Deficit remains large at -5.9% of GDP
Total Credit Market Debt has reached 366% of GDP
Federal Interest Expense has risen to 3.15% of GDP
The market remains balanced between these competing forces.
Inflation Remains Sticky
Inflation continues to be one of the market's biggest challenges.
Core PCE, the Federal Reserve's preferred inflation measure, remains elevated at 3.3%.
Meanwhile, Core Producer Price Inflation (Core PPI) has risen to 4.6%, suggesting inflationary pressures remain embedded within the system.
While inflation has declined significantly from peak levels, recent data suggests the final stage of returning inflation back toward the Fed's 2% target may be more difficult than many investors anticipated.
Persistent inflation increases the likelihood that interest rates remain elevated for longer than markets would prefer.
Rising Oil Prices Could Create New Inflation Pressures
Crude Oil has climbed to approximately $107 per barrel.
Higher energy prices impact the economy through:
Increased transportation costs
Higher manufacturing expenses
Rising consumer fuel costs
Potential pressure on corporate profit margins
If oil prices remain elevated, inflation could prove more persistent, making it more difficult for the Federal Reserve to ease monetary policy.
This is one reason investors are closely monitoring energy markets heading into the next FOMC meeting.
Debt Levels Continue To Rise
Long-term structural risks remain a growing concern.
Current U.S. Government Debt stands at approximately 123.3% of GDP, while the fiscal deficit remains near 5.9% of GDP.
Total Credit Market Debt has expanded to roughly 366% of GDP.
Additionally, federal interest expenses now account for approximately 3.15% of GDP.
These figures do not necessarily indicate an immediate crisis. However, they highlight a highly leveraged economic system that becomes increasingly sensitive to higher interest rates over time.
As debt levels rise, policymakers have less flexibility to respond to future economic shocks.
Monthly Market Outlook: What Investors Should Watch This Month
The Federal Open Market Committee (FOMC) meeting will likely be the most important market catalyst this week.
Investors will be watching for:
Changes to future interest rate projections
Updated inflation forecasts
Commentary on sticky Core PCE readings
The Federal Reserve's view on rising oil prices
Whether policymakers continue to emphasize a "higher-for-longer" interest rate environment
A more hawkish tone could push Treasury yields even higher and place pressure on equities.
Conversely, a balanced or more accommodative message could support risk assets in the short term.
Portfolio Implications For Long-Term Investors
The current environment does not suggest an imminent recession.
Economic growth remains positive, labor markets remain healthy, and financial conditions are not showing significant stress.
However, investors should recognize that the easy gains driven by expanding valuations may become more difficult to achieve.
Going forward, portfolio performance may increasingly depend on:
Strong earnings growth
High-quality businesses
Sustainable cash flow generation
Reasonable valuations
Disciplined risk management
For long-term investors, maintaining a diversified portfolio and focusing on fundamentals remains more important than attempting to predict short-term market movements.
Final Thoughts
The market remains supported by healthy economic growth, stable employment conditions, and manageable financial stress levels.
At the same time, sticky inflation, rising oil prices, elevated debt levels, and Treasury yields approaching 5% are creating meaningful headwinds.
The investment landscape is becoming increasingly selective.
Rather than relying on valuation expansion alone, future market gains may increasingly depend on corporate earnings growth and business fundamentals.
Investors should continue monitoring inflation trends, bond yields, and Federal Reserve policy while maintaining a disciplined long-term investment approach.
Disclaimer: This article reflects my personal opinions and is provided solely for educational and informational purposes. It does not constitute financial advice, investment advice, a recommendation, or an offer to buy, sell, or hold any security, ETF, fund, or other financial instrument. Investors should conduct their own research and consult a licensed financial professional before making any investment decisions.
The data, charts, economic indicators, and market statistics referenced in this article are obtained from publicly available sources, including but not limited to the Federal Reserve (FRED), U.S. Bureau of Labor Statistics (BLS), Bureau of Economic Analysis (BEA), Institute for Supply Management (ISM), U.S. Treasury, CME Group, TradingView, and other third-party financial data providers. All data is believed to be accurate as of the publication date and reflects information available at that point in time.
While reasonable efforts have been made to ensure the accuracy of the information presented, no guarantee is made regarding the completeness, accuracy, reliability, timeliness, or suitability of any data, calculations, charts, forecasts, interpretations, or opinions contained herein. Certain figures may be revised by their original sources, calculations may contain errors, and market conditions may change without notice. Readers should independently verify all information before relying on it.
Any forecasts, projections, Elliott Wave counts, technical analysis, market outlooks, scenario analysis, or forward-looking statements discussed represent personal interpretations and are inherently uncertain. They should not be viewed as guarantees of future performance, market direction, or investment outcomes. Actual results may differ materially from expectations.
Past performance is not indicative of future results. All investments involve risk, including the possible loss of principal. The author accepts no liability for any loss or damage arising directly or indirectly from the use of, or reliance upon, the information contained in this article.
Data referenced in this article is current as of the publication date and may become outdated without notice.


Comments